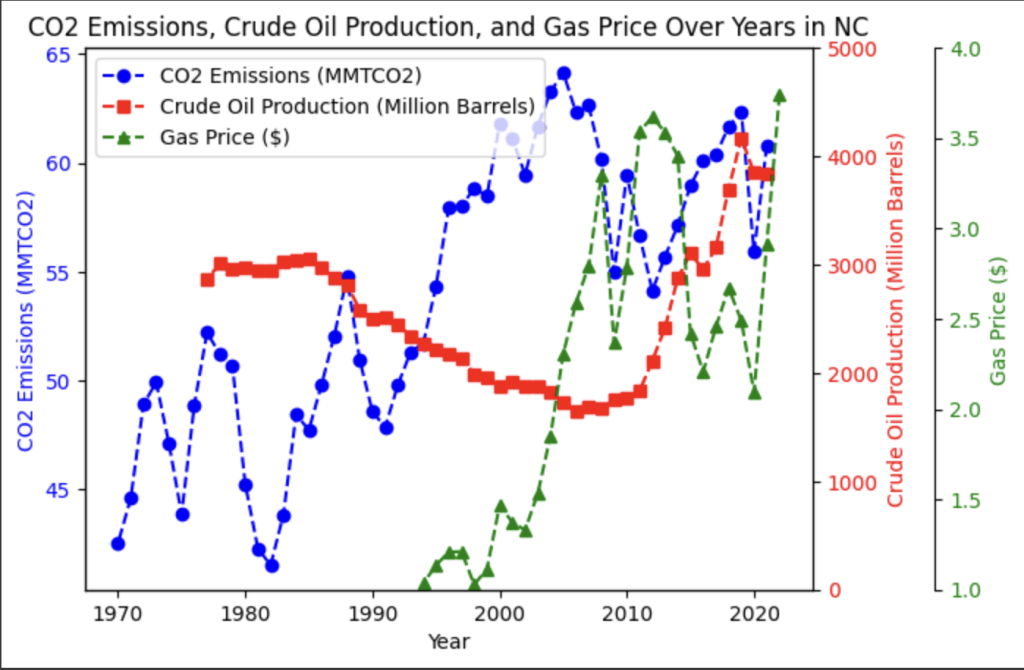
Getting started on my thesis, here is queried and plotted data from many different localized sources to NC, while I am not concerned about CO2 for this thesis, I am concerned about ground level NO(x) emissions which I am going to geospatially do machine learning with.
I found this quite interesting, and obvious uses.
This looks easy but takes several hours to research, query, and visualize.